

Outperform normal
Gut feel and spreadsheets only get you so far. Sybilion gives you full transparency into how its predictions stack up against your historical results and statistical baseline - so you can see exactly where the intelligence is paying off.
Performance Graph
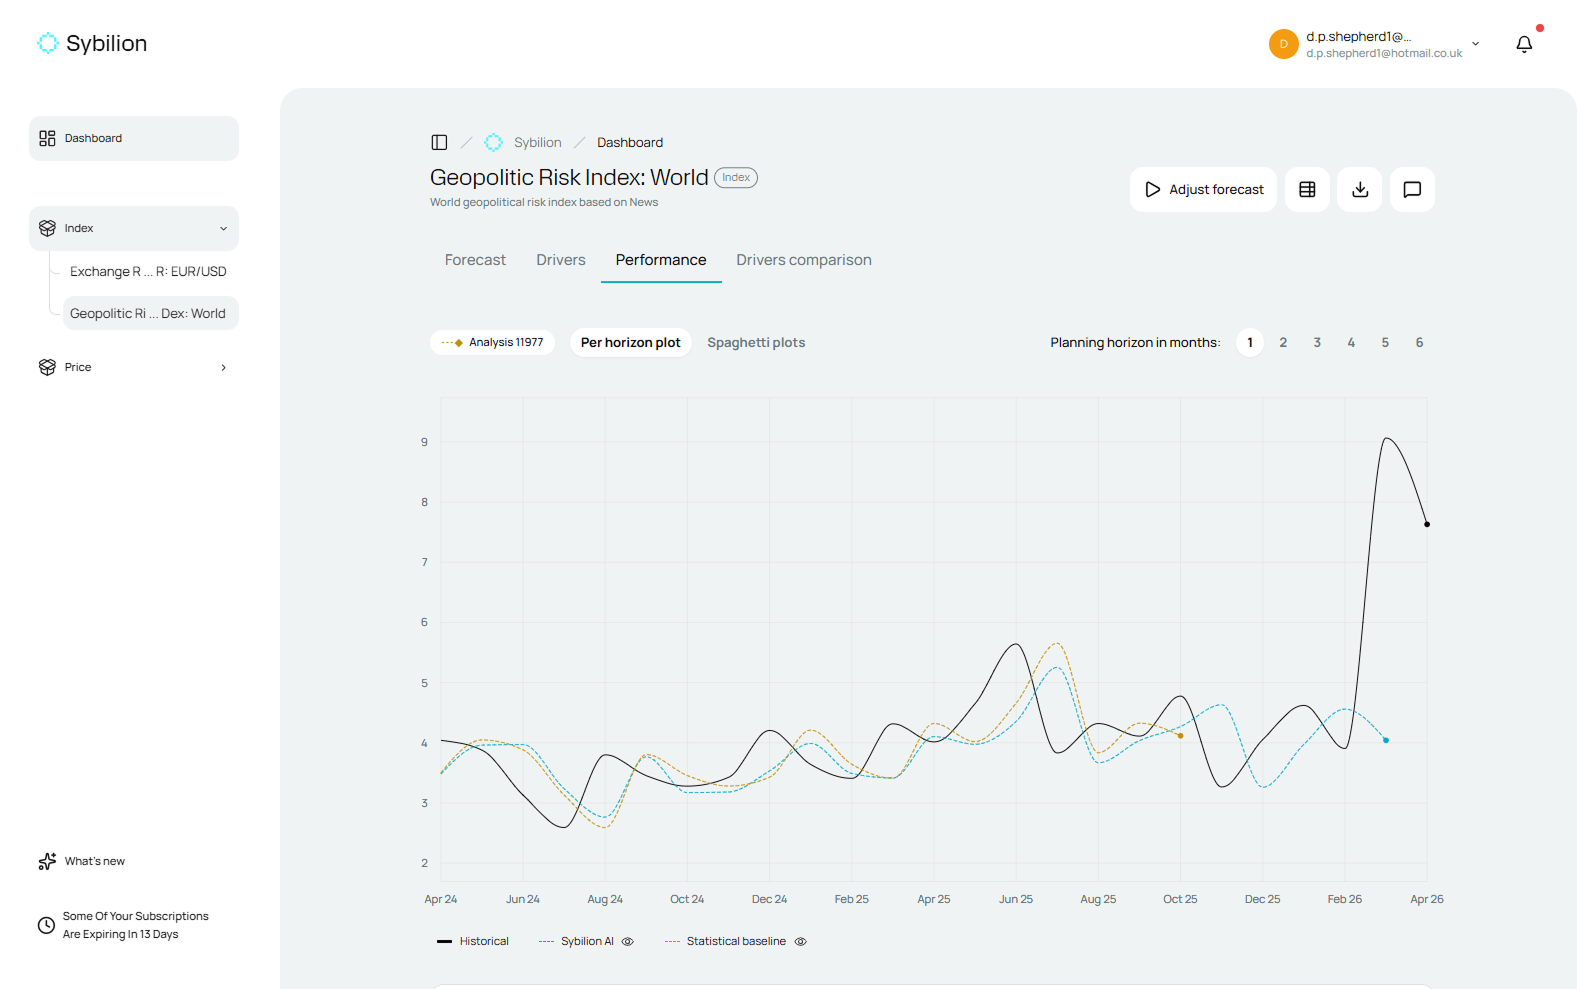
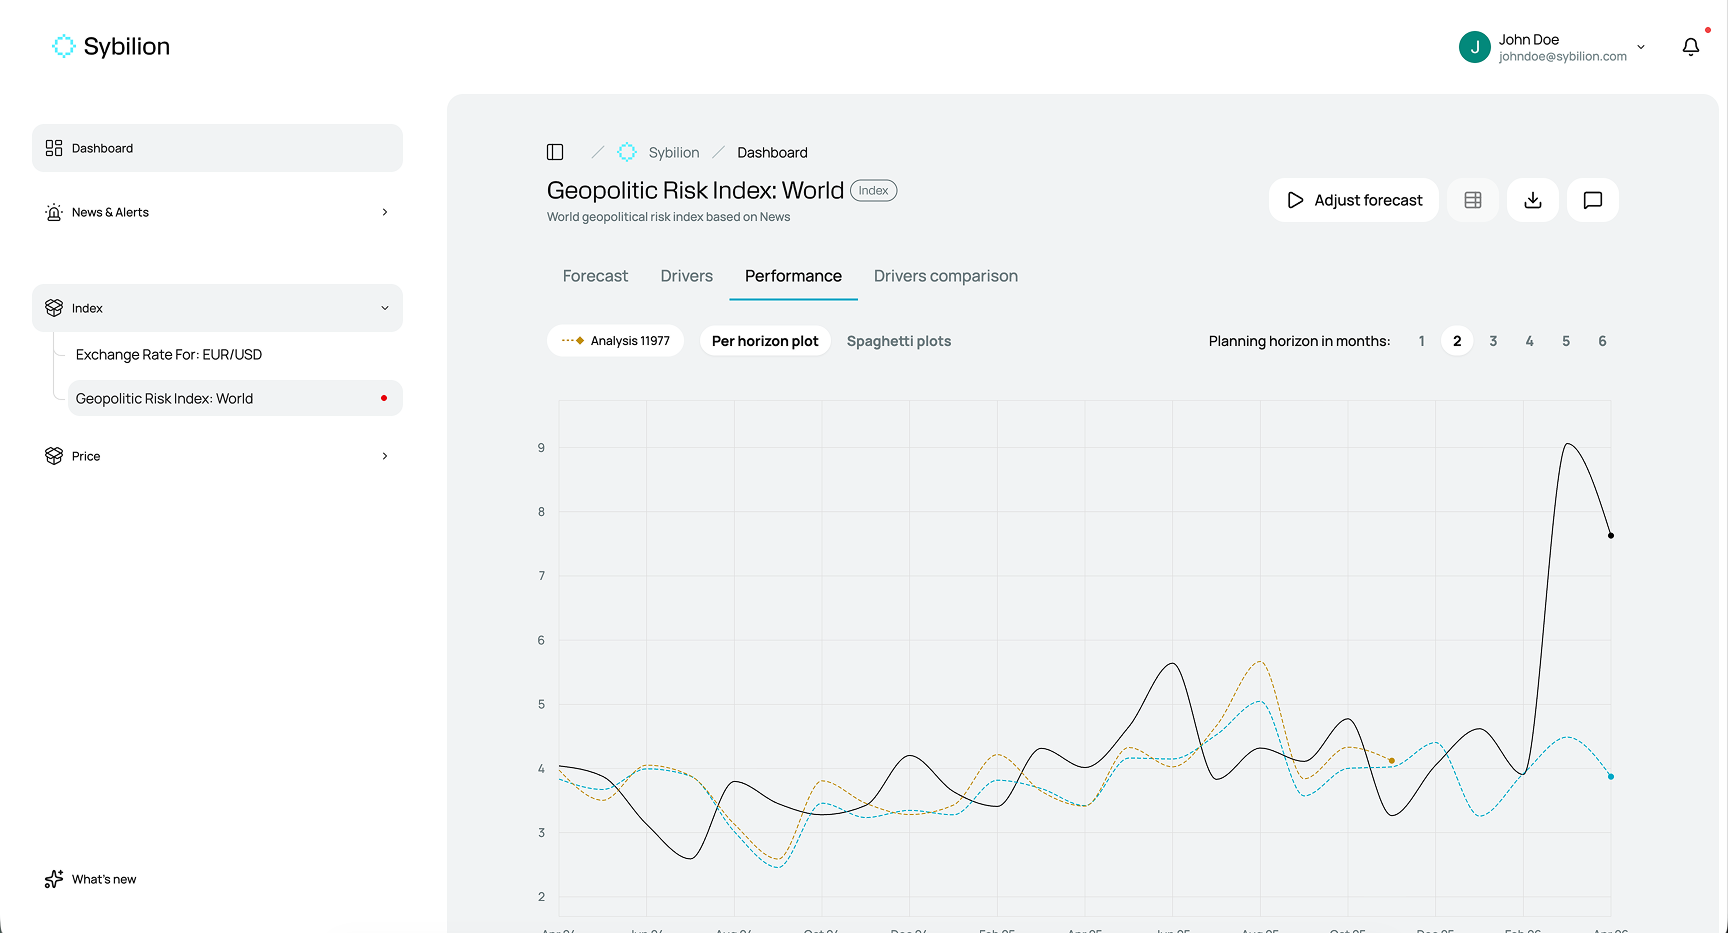
Sybilion's performance graph puts its forecasts side by side with your historical results and a statistical baseline, giving you a clear, honest view of exactly how much sharper your commodity intelligence has become and the confidence to back every procurement decision with evidence.
Tabbed Planning Horizons
Switch between planning horizons with a single click to analyse your forecasts at the timeframe that matters most - whether you're managing short-term procurement exposure or building a long-range supply chain strategy, Sybilion keeps the analysis focused and relevant.
Key Metrics
Sybilion tracks the metrics that translate directly into business value such as accuracy, error rates, ROI, and annual benefit, all in one place. So instead of wondering whether your forecasting is working, you can see precisely what it's delivering and make the case for smarter commodity decisions with hard numbers behind you.
.png)
Businesses around the world trust Sybilion to protect their margins and anticipate unexpected commodity trends




Book a demo today
Stop reacting to commodity price swings and start getting ahead of them. In a personalised demo, we'll show you how Sybilion transforms your sales and ERP data into precise forecasts, surfaces the global signals shaping your markets, and puts AI-powered decision support at your fingertips. See exactly how your team would use Sybilion to cut procurement risk, sharpen supplier negotiations, and drive measurable ROI - all tailored to your commodities and your business. Book your demo today and take the guesswork out of supply chain management.
Frequently Asked Questions
How does Sybilion measure its own forecasting performance?

What is a statistical baseline and why is it used as a benchmark?
What planning horizons does Sybilion support?
How does Sybilion calculate ROI?
How accurate is Sybilion compared to traditional forecasting methods?
How quickly can I expect to see performance results after implementing Sybilion?