

Discover the drivers behind your raw materials
Raw material prices don't move without reason. Sybilion identifies every factor at play, ranks them by impact, and tells you exactly when they'll be felt - turning market complexity into a clear competitive advantage.
Global Drivers Map
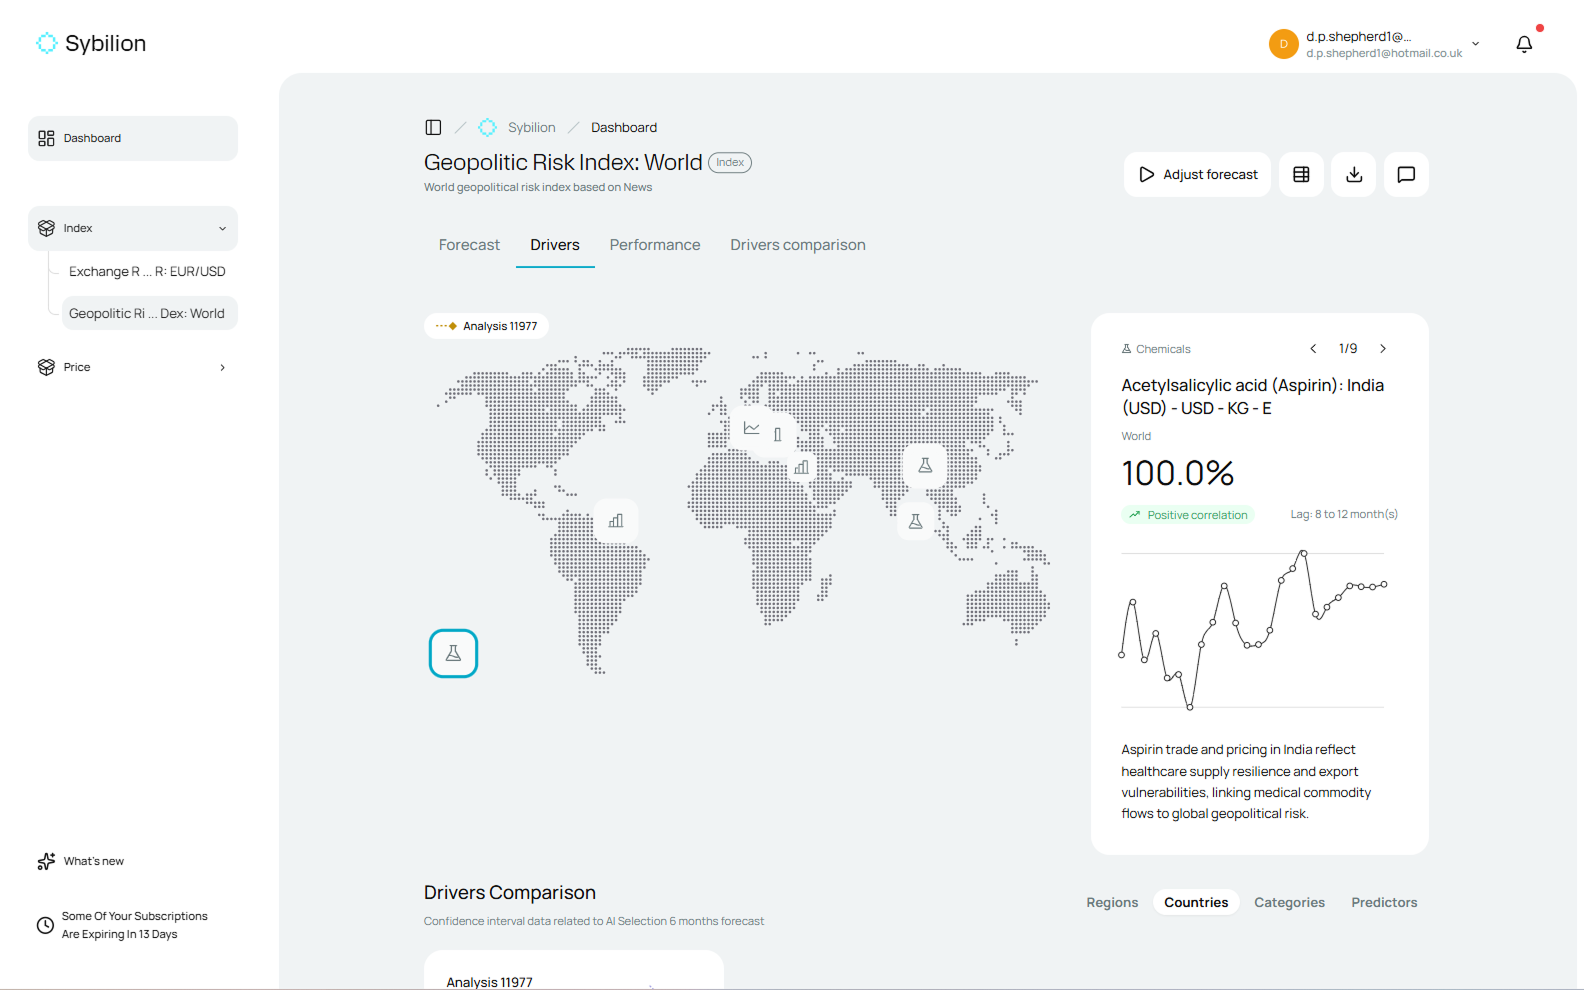
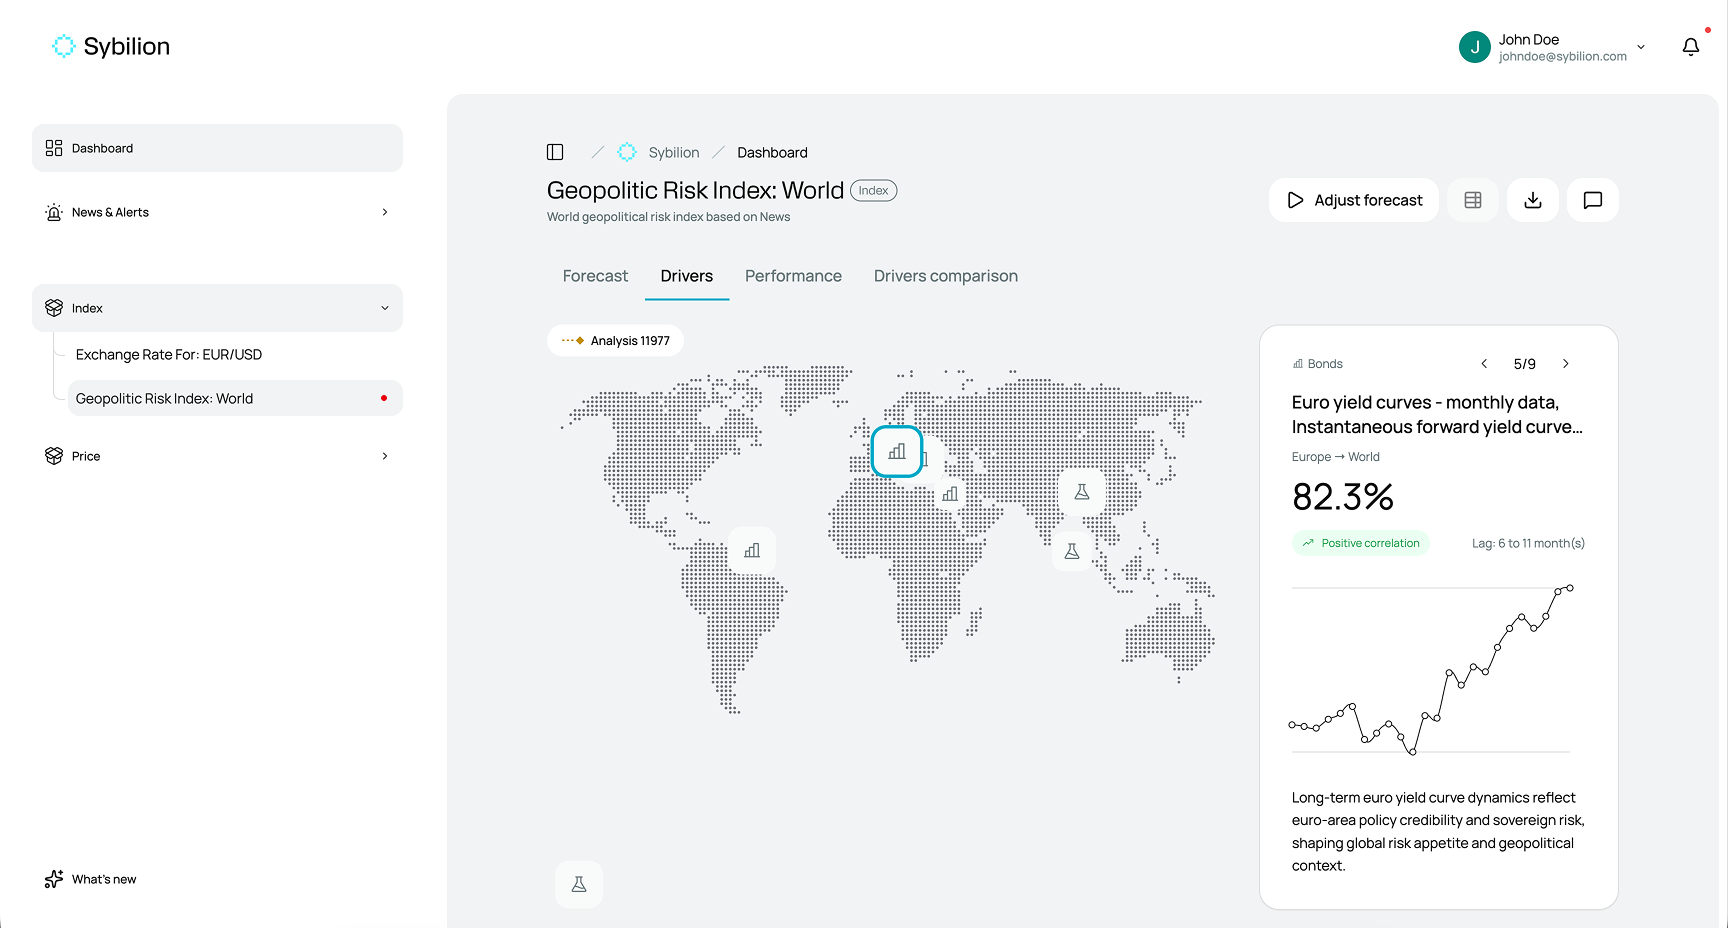
Sybilion plots every key driver influencing your selected forecast on an interactive global map, giving you an immediate, visual understanding of where market forces are originating and how they connect to your commodities.
Correlation tags
Correlation tags on each driver instantly show whether it's pushing prices up or pulling them down - so you can see at a glance which forces are working in your favour and which ones demand attention.
Lag effects
Sybilion goes beyond identifying what's influencing your forecast - it explains how and why each driver has the impact it does, including any lag effects, so you know not just what's happening today but what's coming further down the line.
Driver Comparison
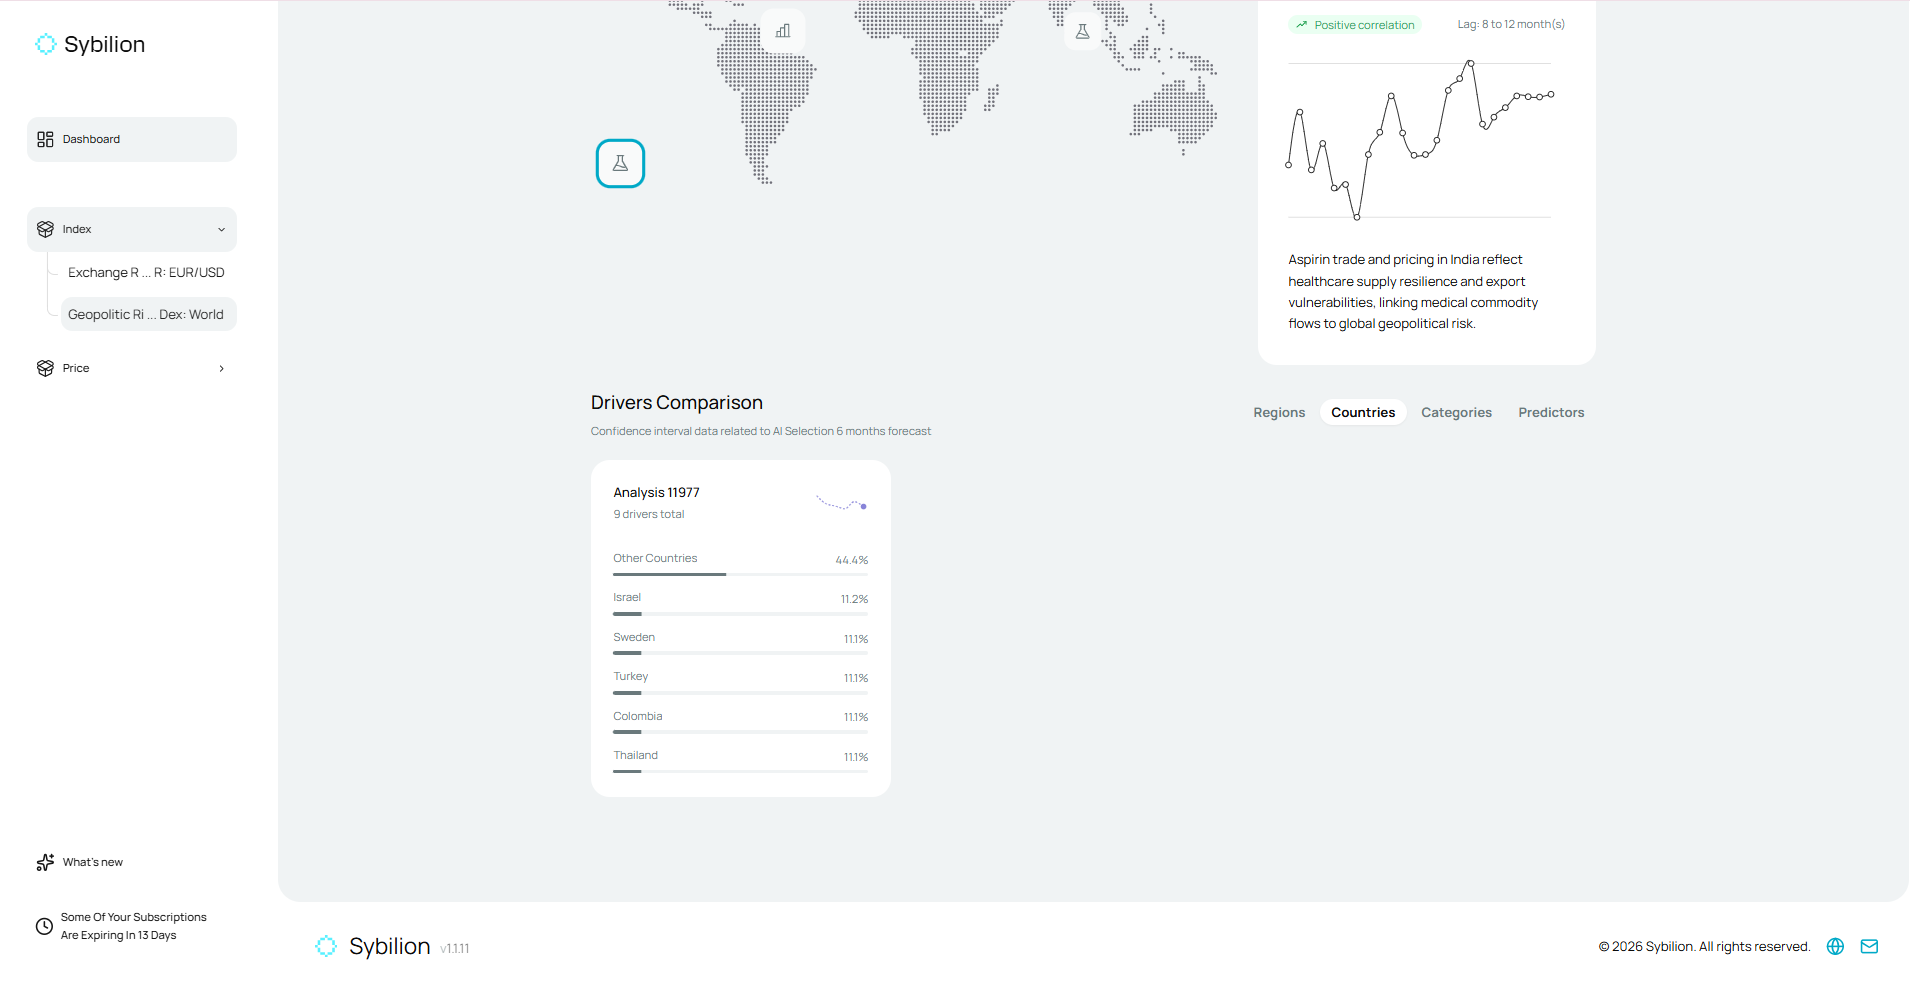
A dedicated comparison chart lets you stack drivers against each other across regions, countries, categories, and predictors - giving your team the granular, multi-dimensional view needed to prioritise risks and opportunities with confidence.
Businesses around the world trust Sybilion to protect their margins and anticipate unexpected commodity trends




Book a demo today
Stop reacting to commodity price swings and start getting ahead of them. In a personalised demo, we'll show you how Sybilion transforms your sales and ERP data into precise forecasts, surfaces the global signals shaping your markets, and puts AI-powered decision support at your fingertips. See exactly how your team would use Sybilion to cut procurement risk, sharpen supplier negotiations, and drive measurable ROI - all tailored to your commodities and your business. Book your demo today and take the guesswork out of supply chain management.
Frequently Asked Questions
What is a commodity driver?

How does Sybilion identify which drivers are relevant to my commodities?
What is a lag effect and why does it matter?
How do correlation tags work?
How does the driver comparison chart help my procurement team?
Can drivers change over time?